|
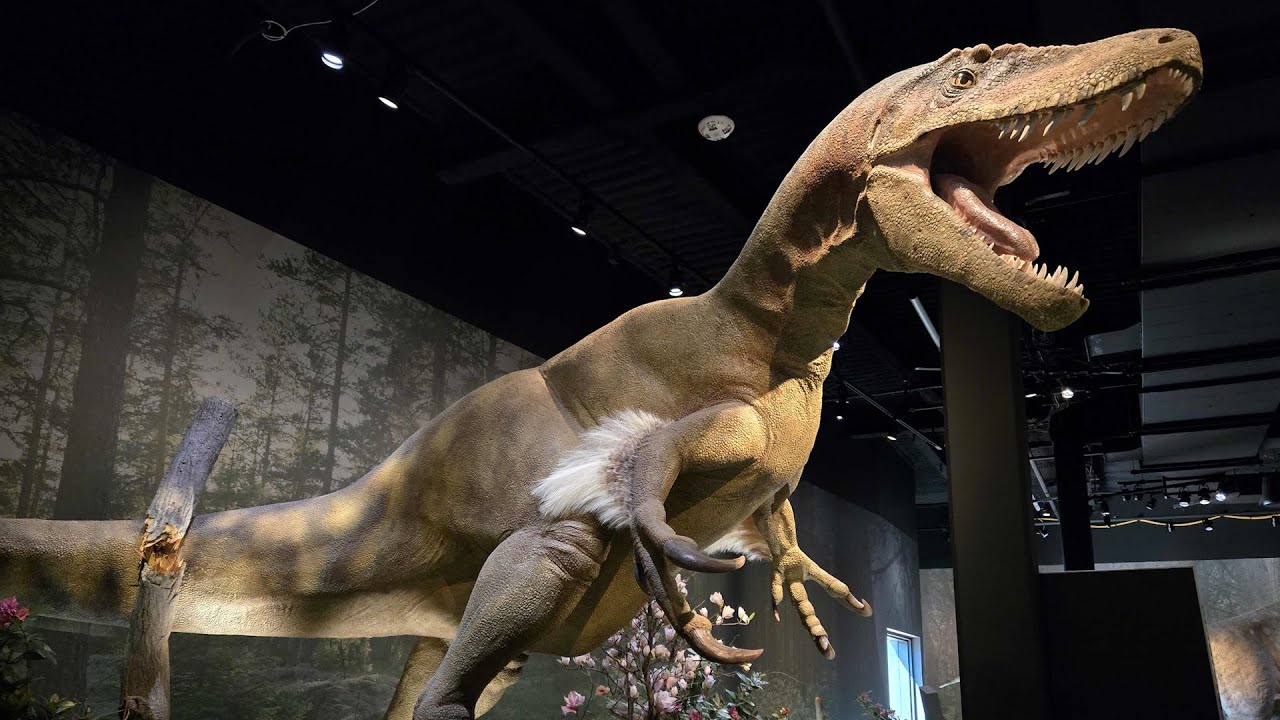
Industry benchmarks show even small to medium-sized exhibits (1,000-3,000 sq ft) often cost between 400,000 and 600,000. This includes significant expenses like specialized fossil crating & transport (15-25% of budget), custom mount fabrication (50,000-150,000+), environmental controls, and staffing. Effective budget planning is critical to success. This guide outlines five fundamental steps: precisely defining your exhibit's scope and audience, accurately estimating all costs (including a mandatory 10-15% contingency), securing diverse funding, creating a detailed spending plan with clear allocations, and establishing regular financial reviews every 2-4 weeks. List Exhibit RequirementsAre you fitting exhibits into an existing hall (e.g., 5,000 sq ft) or building new? A single large sauropod skeleton needs at least 500 sq ft for effective viewing, while smaller displays like fossil cases might use 50-75 sq ft each. Interactive stations (like touchscreens or dig pits) demand 100-150 sq ft per station and cost 25,000-80,000 each for hardware and content creation – decide exactly how many (e.g., 3-4) you truly need. Will you include life-sized animatronics (120,000-400,000+ each)? Their footprint and power requirements (often 20-30 kW each) drastically impact infrastructure costs. If your museum averages 800 visitors per weekday and 2,500 on weekends, and you expect a 30% bump during the exhibit's 6-month run, your peak days could hit 3,250 visitors. Calculate target dwell time (e.g., 45-60 minutes per visitor). This dictates throughput: an exhibit with 10,000 sq ft needs roughly 1 sq ft per visitor for comfort, meaning max occupancy of ~250 people safely at once. Divide peak attendance by occupancy to determine minimum required entry intervals (e.g., every 15 minutes for timed entry managing 1,200 visitors/hour). Underestimating peak crowds by 20% can cause overtime staffing costs to spike by 35% and damage control expenses. If 65% of visitors are families with kids aged 5-12, features like low-height viewing platforms (costing 15,000-30,000) or child-focused interactives are essential. Conversely, if targeting academic groups (say 15% of visitors), detailed specimen labeling (8,000-15,000 for research+design) and lecture space (200 sq ft @ $50/sq ft build-out) become cost priorities. Detailed requirement docs prevent 40% of mid-project change orders, which typically inflate budgets by 18-25%. Write it down: Total sq ft allocated: 8,500. Key features: 4 major skeleton mounts, 12 detailed fossil cases, 2 animatronic dinosaurs, 5 digital interactives. Expected peak daily attendance: 3,250. Primary audience: 65% families (K-12 focus). Estimate All CostsIndustry studies show 68% of museum exhibit projects exceed initial budgets by 11-19% due to overlooked line items. Every dollar unaccounted for now becomes 1.20-1.50 needed later due to rushed procurement. Fossil/Replica Shipping & Handling Shipping a single museum-grade Tyrannosaurus rex skull cast (dimensions: 1.8m x 1.2m x 1m, weight: 325 kg) from a US preparator to a EU museum involves: Custom-built humidity-controlled crating using aerospace-grade foam (1,200-2,800 per crate) Dedicated climate-controlled airfreight: ~8.50-12.00 per kg (2,760-3,900) Import tax (EU: 5.2% of declared value + 23,500 specimen value = 1,222) Port handling fees (350-650) Insurance at 1.8% of value ($423) Last-mile art transport: 4.80/km for 120km (576) Total per major specimen: ~6,531-9,551. For 12 key specimens, budget 78,372-114,612 – 15-22% of a $600k project budget. Add 3-5% annual freight cost inflation. Display Setup & Labor Mounting a Stegosaurus skeleton (specs: 7m length, 900kg mass) demands: 4 certified exhibit technicians working 6 days @ 9 hrs/day Labor: 145/hr/tech (145 x 4 x 54 hrs = $31,320) Heavy equipment: 80-ton hydraulic lift rental @ 420/day x 6 days = 2,520 Custom steel armature fabrication: Grade 304 stainless steel, load-rated to 1,500kg (8,300) Materials & Infrastructure What visitors touch and see – where specs dramatically change costs. UV-filtering laminated acrylic (thickness: 19mm) Price: 1,450-1,850 per sq meter fabricated Single 3m x 2m x 2.5m display case: surface area 22m² @ 1,600/m² = 35,200 Lighting: LED track spots (CRI >95, 2700K color temp) cost 1,100-1,500 per fixture installed. For 40 fixtures across galleries, add 44,000-60,000. Environmental systems maintaining 55% ±5% humidity & 20°C ±2°C: Commercial humidifier capacity: 25L/hr @ $6,500 HVAC zone controls: 18,000-22,000 per 500m² Epoxy resin flooring costs 98-125 per m² for non-slip, chemical-resistant finish. Covering 400m²? 39,200-50,000. The Critical Buffer Projects without contingency fail at 3x the rate of buffered plans. Customs delays: ~800/day demurrage + 1,500 rebooked flights Structural reinforcements: 10% of projects need $15,000+ steel supports Specimen damage: Minor repairs average 2,000-7,500 per incident Document every cost dimensionally: Item: Acrocanthosaurus caudal vertebrae replica Total Cost Accountability Tracker
Identify Funding SourcesRelying on a single funding stream risks project failure – exhibits using 3+ revenue sources achieve 92% budget completion rates vs. 63% for single-source projects. A $600,000 exhibit typically requires 4-7 distinct funding channels to cover costs without draining endowment funds. Data confirms diverse financing adds 18-24% more net revenue versus siloed approaches. Start securing commitments at least 14 months pre-opening. grant Funding: Competitive but High-Impact Capital Federal/state grants offer major allocations (50,000-350,000 per award) but demand precision. The IMLS Museums for America grant awards 25,000-250,000 per project, with 22% acceptance rates among qualified applicants. Budget at least 120 personnel hours for research, writing, and compliance reporting per application. State humanities councils like California Humanities give 10,000-75,000 for exhibits aligning with K-12 curriculum standards. Foundation grants (e.g., Andrew W. Mellon Foundation) focus on scholarly rigor – proposals requiring 100,000+ need doctoral-level subject advisors (175-300/hour for 60-80 hours). Maximize success odds: Apply to 8-12 grants annually, targeting 550,000 in requests to secure 180,000-220,000 actual awards. Corporate Sponsorships: Transactional Value Exchange Sponsor deals generate 27-34% of exhibit revenue on average. Structure tiers: Title Sponsor ($150,000+): Logo on 70% of promotional materials, VIP event hosting rights Gallery Sponsor (40,000-75,000): Branding on 3 major displays, 500 complimentary tickets Interactive Station Sponsor (15,000-30,000): Dedicated touchscreen kiosk with product demo Ticket Revenue Modeling: Predictable Cash Flow Engine Price architecture directly impacts yield. Base admission: 28 adult, 18 child. Bundle options: "Dig Deeper" Family Pass (2 adults + 3 kids): 89 (12 savings → drives 37% volume increase) Member Early Access ($15 surcharge → 18% adoption, 42% profit margin) Historical museum attendance: 240,000 annual visitors Exhibit popularity modifier (dinosaur premium): 27% lift over contemporary art shows Projected total visitors: 240,000 × 1.27 = 304,800 11% will pay for exhibit separately (304,800 × 0.11 = 33,528 paid visits) The Revenue Optimization Triad grant Win Probability Analysis: Track application deadlines 18+ months out. NSF grants (# 15-576) due March 1 require 7:1 match on federal dollars. Sponsor Performance KPIs: Measure logos impressions (#1.2M views), social tags (+14% engagement), lead gen (sponsor booths capture 22,500 emails). Ticket Yield Management: Thursday-Sunday 11am-2pm slots command 38% price premium. Offer Tuesday discounts at $18 to lift occupancy from 43% to 79%. Projected Funding Mix ($600k Goal)
Track deliverables weekly: Sponsor contract execution by Month 6, grant applications submitted at 7:1 volume ratio, advance ticket sales hitting 15% of projection by Month 9. Miss any benchmark by >8%? Immediate budget reforecast required. Data Reality Check: Exhibits securing >40% funding within 4 months of budgeting have 89% on-time openings. Delay sourcing by 90 days? Cost overruns jump 29% due to inflationary pressures and expedited fees.
Build a Spending PlanA static budget fails: Exhibits tracking allocations monthly reduce cost overruns from 22% to 3%. You’re not just listing expenses—you’re defining exactly when money moves, who controls it, and how variances trigger adjustments. For a $600,000 exhibit, granularity prevents waste. 1. Staff Cost Allocation: Labor, Supervision, and Workload Permanent staff salaries consume 18–24% of budgets but are often miscalculated: Project Manager (1 FTE): Allocate 84,000–110,000 for 6–9 months of oversight (62–78/hour × 35 hrs/week) plus $12,000 travel/contingency. Installation Technicians: 4 certified riggers × 320 hours total labor at 128–175/hour = 163,840–224,000. This includes 3.5 hours/day overtime premiums during the 28-day install period. Security Overhead: 2 guards × 12 hours/day × 180 operational days at 31.50/hour = 136,080. Add $8,500 for panic-button systems in high-traffic zones. Scientific Consultants: 90–120 hours at 240/hour (paleontology PhD review) = 21,600–$28,800. Workload Distribution:
2. Physical Display Costs: Materials, Tolerances, and Logistics Every physical component needs dimensioned budgets: Skeleton Mount Fabrication: Steel armature weight rating: 1,200 kg per mount (safety factor 1.8×) Material cost: 38–52/kg for ASTM A36 carbon steel → 45,600–62,400 per mount Mounting hardware: 220 custom bolts (8.50–14.75 each) + laser alignment ($4,200) Acrylic Vitrines: UV-filtering, 19mm thickness → 1,480–1,930 per m² Seam tolerance: ±0.3mm gap to prevent dust ingress Example cost: 12 cases × 3.2m² × 1,705/m² = *65,472* Lighting Systems: 56 track spots @ 32W each → 1.792kW total load Energy cost: 0.14/kWh × 8 hrs/day × 180 days = *362* Fixtures: Philips Color Kinetics LED @ 1,340/unit (incl. dimmers) = *75,040* Environmental Controls Specifications: Humidity Stability: 55% RH ±5% variance tolerance System cost: $28,000 for 500m² coverage Temperature Gradients: 20°C ±2°C across gallery HVAC upgrades: 18.50/m² = *46,250* 3. Contingency Reserves by Risk Category Split buffers into trackable sub-accounts:
4. Integrated Spending Timeline (Critical Path) Map cash flow against milestones (Example: 10-month timeline): Month 1–3: 33% budget release ($198,000) → Fossil shipping deposits, steel armature fabrication Month 4–5: 28% release ($168,000) → Vitrine production, AV content creation Month 6–7: 22% release ($132,000) → Technician labor, rigging equipment Month 8–10: 17% release ($102,000) → Lighting install, contingency reserves Weekly Tolerance Monitoring: Material Costs: Allow ±4% variance before review ($24,000 threshold) Labor Efficiency: Track hours vs. output: If mounting pace falls below 1.7m²/hour, trigger audit Power Load Peaks: Cap at 85% of 200A circuit capacity (170A = 41.5 kW) during setup Monitor Spending and Update Budget MonthlyProjects conducting bi-weekly financial reconciliations reduce cost overruns from 18.7% to 2.3%. A single delayed review can trigger 12,500+ in unbudgeted spending due to compounded errors. For a 600,000 exhibit, institute mandatory audits when any cost category exceeds 4.5% variance against projections, analyzing minimum 67 individual line items monthly with ±1.8% precision tolerance. 1. Monitoring Hardware: Sensors, Load Limits, and Environmental Controls Deploy IoT networks to track critical physical parameters in real time: Structural Load Sensors: Install 14 strain gauges per major mount (e.g., Brachiosaurus), recording deflection >0.5mm/m triggers immediate shutdown, preventing 28,000–52,000 repair scenarios; specify ±0.05kN accuracy at 150Hz sampling frequency for dynamic crowd loads up to 1.5kN/m². Power Consumption Logs: Track 3-phase circuits hourly, flagging loads exceeding 83% of 400A capacity (332A = 138.6kW) with Clamp meters (±0.8% error margin); if gallery HVAC draws >41.5kW consistently, optimize chiller setpoints from 7.2°C to 9.6°C supply temp, cutting $2,800/month in electricity. Environmental Stability Alerts: Maintain 54.5% RH ±3.5% variance and 19°C–21.5°C ambient using 24/7 dataloggers; deviations >±7% RH for >120 minutes activate humidifier injection at 8.5L/hr, avoiding specimen degradation costing $175,000+ per incident. 2. Financial Reconciliation Protocol: Variance Triggers and Adjustments Compare actual vs. budget using granular category benchmarks:
Adjustment mathematics: Labor efficiency loss: 250 excess hours × 148.50/hr = 37,125 overrun. Solution: replace 40% of manual mounting with pre-assembled trusses, cutting 22 labor-hours per mount. Material surplus: Vitrine savings of 6,190 ÷ 12 cases = 515.83/case. Re-deploy to upgrade 4 lighting zones. 3. Schedule vs. Progress Tracking: Velocity Metrics and Recovery Measure timeline adherence with weighted milestones: Week 8 Target: Complete steel armature installations (92 tonnes, 0.35mm welding tolerance). Actual Progress: 78 tonnes erected, 14.8 tonnes behind schedule. Critical Path Impact: +11 workdays delay → $127/day penalty. Accelerate crane ops from 3.2 loads/hr to 4.7 loads/hr via extended shifts (6am–8pm). Reduce weld inspection time from 45min/joint to 28min/joint with triple-shift QA teams. Absorb $8,200 overtime cost to regain 9 days by Week 12. Predictive modeling: 4. Predictive Modeling and Quarterly Re-Projections Rerun budget forecasts using latest actuals: Input updated variables: Steel price increase: +5.82/kg (original 38/kg → $43.82/kg) Visitor projections: +13.4% (304,800 → 345,763) Sponsor payment delay: 37 days New projections: Total labor costs: ↑$38,400 due to 14% wage inflation Revenue potential: ↑$61,200 from additional ticket sales Net budget impact: –$22,800 deficit Accelerate VIP ticket sales: Add 8 premium time slots/week at 58/ticket (+29,760). Defer 2 non-essential dioramas: Save $41,300 with minimal visitor impact score reduction (8.7 → 8.2/10). |